
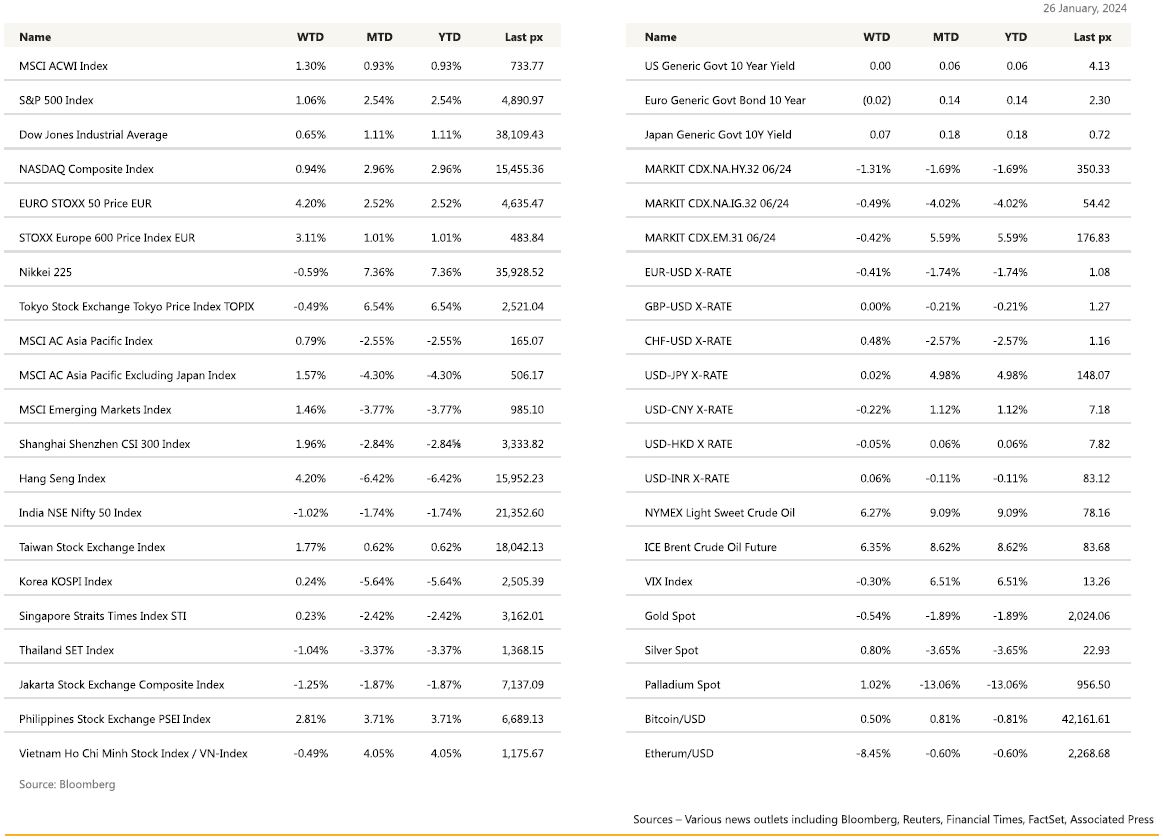
KEY MARKET MOVES
Source: Bloomberg
MACRO OVERVIEW
US
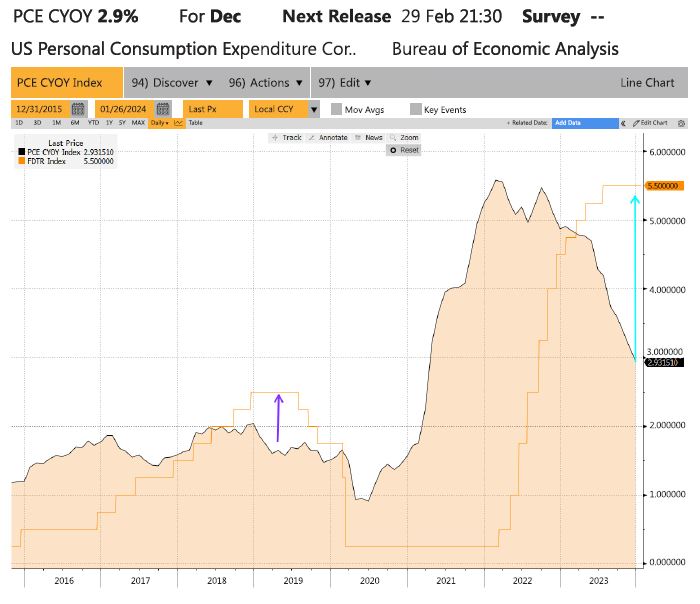
The big three indices each made new all-time high closes during the week. Sentiment was fuelled mainly on optimism that a soft landing indeed could be engineered by the Fed, as early robust earnings releases topped or beat estimates and GDP indicated no signs of an impending or delayed recession. The VIX continued to hover about 13. Q4 GDP came in at 3.3% against consensus of 2% and cheered on by gains in consumer spending, business investment and housing. Markets had whipsawed on the back of the data releases with some tilting on Fed delaying rate cuts on the back of these stronger number whilst the rest favoured an ideal situation for the Fed to cut with cooling inflation amidst a firm economy. Weekly jobless claims rose to 214k versus expectations of 200k. The Federal Reserve’s preferred gauge of underlying inflation, PCE rose at its slowest annual pace in roughly three years, bolstering hopes that officials will cut rates soon. Year on year, the PCE core deflator came in at 2.9% from 3.2% whilst the headline was at 2.6% as expected. The “2%” as an integer in this metric, indicates that we are now in the Fed’s zone of its inflation target.
Much better January PMI’s, Services printed at 52.9 Vs 51.5 expected and Manufacturing printed at 50.3 Vs 47.6 expected, highest level since October 2022. Stabilizing manufacturing in the US could be supporting US small cap with domestic exposure.
The last time the PCE core rate was below that of the (upper band) Fed Funds rate, over the last 8 plus years, was for about 90 bps. As of Friday, we are currently at 260 bps below. Excessive buffer perhaps?
Fed meeting on Thursday will be closely scrutinised for any language alluding to its path to easing. No change expected at this meeting.
The week will see a slew of earnings reports from big tech firms — including Apple Inc., Google parent Alphabet Inc., and Meta Platforms Inc. which will certainly test a stock rally that, by many metrics, already looks stretched. Fed decision aside Thursday, we’ll get more US data during the week. Most important will be the monthly jobs report on Friday where we expect unemployment to come in at 3.8% and NFP at 180k.
JOLTS Job openings and consumer confidence data on Tuesday — and a quarterly employment cost index release on Wednesday, during the Fed meeting which will be interesting to see how strong the outlook for spending really is. We’ll also get consumer sentiment and inflation expectations data on Friday, the January ISM Manufacturing and as usual on the first Friday of each Month, all the data regarding the job market.
We continue to advocate to the smaller cap index, where the Russell 2000 Value Index offers a good entry point to a much less hot market with lower P/B and reasonably lower, less outlandish forecasted growth values. Articulate through the IWN ETF (iShares Russell 2000 Value ETF).
Europe
Euro market closed at a two-year high Friday, with the European Stoxx 600 closed 1.1% higher and sectors were mostly in positive territory. Household goods jumped 5.2%, while tech stocks shed some of their recent gains, trading 0.7% lower.
January PMIs in the Euro area saw a marginal uptick in the composite output index which was driven purely by manufacturing output as services output fell on the month. The services PMI output index fell from 48.8 in December to 48.4 in January, but a rise in manufacturing PMI output index from 44.4 to 46.6. In the UK, the services PMI output index rose for the 4th consecutive month to 53.8 in January from 53.4 in December. Manufacturing output declined for a second consecutive month printing at 44.9 in January from 45.5 in December.
On price balances, in the euro area, the composite PMI input and output price balances both rose on the month. This rise was almost entirely driven by the services sector, whereas manufacturing price balances were broadly unchanged or declined marginally. With the composite PMI output price balance rising for a 4th consecutive month, and printing at its highest level since May 2023. The labour market remains as a source of pressure in the services sector, coupled with the fact that employment balance improved, services inflation has proven to be persistent, a concern ECB has raised numerous times. In the UK, the price balances were slightly better, with the composite PMI input price balance barely budging and the composite output price balance declining by almost 1pt. For both the ECB and the BoE, the focus at the moment is squarely on the services sector rather than manufacturing, and also squarely on inflation rather than growth. In that sense, the January PMIs were hawkish.
Last week, as widely the ECB left its policy rate unchanged expected. The deposit rate was kept at 4% for the 3rd consecutive meeting. The tone of the discussion was more favourable to near term cuts (especially in April) than suggested by last week’s comments. The ECB remains datadependent. From that perspective, this week’s HICP release will be key focus.
On growth, the ECB said that GDP likely stagnated in 4Q23, which is a downgrade from the assumption of a 0.5% q/q gain. However, President Lagarde added that some forward-looking indicators may hint at an improvement which includes the PMI and the labour market remains very resilient.
On inflation, President Lagarde said that the December report was a little lower than expected. She said ‘’almost all measures of underlying inflation declined further in December’’ but ‘’the elevated rate of wage increases and falling labour productivity are keeping domestic price pressures high’’. Ultimately, the January meeting seemed more dovish. The front end of the curve rallied during the press conference, with the market pricing in 10bps more of rate cuts in 2024 vs prior to the meeting.
This week, we will see flash figures of GDP and HICP, PMI manufacturing final and unemployment rate in the Euro area. We will also have the UK BoE policy meeting this Thursday and we expect no change in policy and most likely a dovish adjustment to the Bank’s guidance.
Asia
Asia equities mostly ended with a positive tilt. MSCI Asia ex Japan closed +1.5% last week. Hang Seng took the lead, closing higher by 4.2%. Japanese shares dropped, with Nikkei lower by 0.59%, retreating from a 34-year high hit as bets ramped up that the Bank of Japan (BOJ) could soon exit its massive stimulus.
Chinese shares rallied. PBOC announced a 50 bps RRR cut on 5th Feb 2024, which will inject CNY1T ($139B) of long-term liquidity into the market. This is the 4th cut since Dec 2022, with last cut on 14-September 2023 by 25bps. The Central bank also said it is widening uses for commercial property lending by banks in latest effort to ease liquidity crunch facing troubled developers. CSRC also pledged better investor protection, especially for small- and medium-sized investors, a top priority and prompt listed companies to provide better returns to stabilize capital market. Shares of China central stateowned enterprises surged Thursday with A-share of PetroChina (857.HK) touching a daily limit of 10% gain for the first time since July-15. Hang Seng also rebounded from its lowest level since Oct-22. Chinese equities will look to build on their first weekly gain since the end of December, after the nation’s securities regulator announced Sunday it will halt the lending of certain shares for short selling from Monday.
China plans to “merge” three of its biggest bad debt managers into China Investment Corp., the country’s $1.24 trillion sovereign wealth fund, Xinhua News Agency reported Sunday, citing unidentified people. The extent of the transfer of China Cinda Asset Management Co., China Orient Asset Management Co. and China Great Wall Asset Management Co. wasn’t clear in the report. The move is being taken as part of China’s plan to reform institutions.
BOJ deliberations on ending NIRP have entered the final stage. With inflation forecasts on track to overshoot the 2% target for the fourth straight year, conditions will be met if strong wage growth continues. Japan flash manufacturing PMI was 48.0 in January, up from 47.9 in the previous month.
Singapore’s central bank kept its monetary policy settings unchanged for a third straight time MAS Core Inflation came in at 4.2%, this morning. slightly higher than the 4.1% in 2022. However, excluding the impact of the GST increase, core inflation would have fallen by an estimated 0.6%-point in 2023 compared to 2022. CPI-All Items inflation averaged 4.8% in 2023, down from 6.1% in the preceding year.
Thailand’s benchmark interest rate is “too high,” hurting the standard of living of people and weighing down the economy, according to Deputy Finance Minister Julapun Amornvivat who urged the central bank to consider easing monetary policy.
China and Thailand signed an agreement on mutual visa exemption which will come into effect 1st March.
Thailand is also in the process of easing restrictions for foreigners to conduct business in the country and attract more investment. Amendments are expected to be completed by the end of Feb, which include reducing the burden of residency reporting every 90 days as well as lower the worker ratio of Thai to foreign employees.
Other data from Asia – South Korea Q4 GDP growth of 0.6% for the fourth quarter brings total 2023 growth to 1.4%. The central bank has forecast the economy will grow by 2.1% this year. Tokyo CPI softer than expected and BOJ minutes showed intensifying debate on easing exit. Singapore manufacturing output unexpectedly dropped while exports from the Philippines and Thailand both fell by more than expected.
Data and central bank meetings to dominate a busy week for markets, with China PMI, the FOMC and BOE gatherings and US payrolls among the highlights for this week.
GeoPolitics
China – Iran: Chinese officials have asked their Iranian counterparts to help rein in attacks on ships in the Red Sea by the Iran-backed Houthis, or risk harming business relations with Beijing. The attacks, which the Houthis say are in support of Palestinians in Gaza, have raised the cost of shipping and insurance by disrupting a key trade route between Asia and Europe used widely by ships from China. While China has been Iran’s biggest trading partner for the past decade, their trade relationship is lopsided. Chinese oil refiners, for example, bought over 90% of Iran’s crude exports last year, according to tanker tracking data from trade analytics firm Kpler, as U.S. sanctions kept many other customers away and Chinese firms profited from heavy discounts.
US – Iran : The US said Iranian-backed militants killed three service members and wounded 25 others in a drone attack near the Syrian border, the first American deaths under enemy attack since Israel and Hamas went to war.
President Joe Biden vowed retaliation, saying in a statement that “we will hold all those responsible to account at a time and in a manner our choosing.” Oil prices jumped after the deadly attack on US troops and a Houthi missile strike on a fuel tanker on Friday. West Texas Intermediate crude rose as much as 1.6% to the highest since November as the trading week began.
US – China: The US wants cloud services providers such as Amazon.com Inc. and Microsoft Corp. to actively investigate and call out foreign clients developing artificial intelligence applications on their platforms, escalating a tech conflict between Washington and Beijing. It such firms to reveal foreign customers’ names and IP addresses. If implemented, Washington could use those requirements to choke off a major avenue through which Chinese firms access the data centers and servers crucial to train and host AI.
Credit/Treasuries
Over last week, the US Treasury Curve Bear Steepened, the 2years US Treasury yield was down by 6bps, 5years down 3bps, 10years yield was unchanged & 30years yield was up 4bps. Both IG & HY credit spreads finished the week unchanged.
In term of performances, US IG lost 0.15%, US HY gained 0.50% and leverage loans were unchanged.
Finally, sharing on Deutsche Bank’s 2024 core view. They believe that bond and equity prices correlation will finally broke. They explain that the key reason bonds and equities sold off in 2022 and then rallied in 2023 was that supply shocks became the dominant driver of the global economy. Last year was all about the unwind of the COVID/Russia shock which allowed inflation to drop (bonds higher) and growth to do well (equities higher) at the same time.
But why should this relationship break this year? Because, with the supply shock over, a more “normal” demand-driven world is likely to become a better framework for understanding markets. In this environment, if US growth continues to outperform, risk assets can do well but yields can rise too as the market cannot price more Fed cuts. The most extreme version of this scenario would be the 1995 soft landing where the Fed only cut by 75bps as US growth never slowed and estimates of neutral moved sharply higher.
FX
DXY USD Index rose 0.14% to close the week at 103.43, driven by strong US macro data. US 4Q23 Real GDP rose 3.3% q/q (C: 2.0%; P: 4.9%), while Core PCE Index rose 2.0% q/q in 4Q23 (C: 2.0%; P: 2.0%). This report affirmed growth remained strong through the end of the year, with only a modest slowdown in private final domestic demand into year-end. US Mfg PMI rose to 50.3 (C: 47.6; P: 47.9), while Svc PMI rose to 52.9 (C: 51.5; P: 51.4). Core PCE Inflation rose by 0.17% m/m in December (C: 0.2%; P: 0.1%) and lowered the y/y rate to 2.9% (C: 3.0%; P: 3.2%).
EURUSD fell 0.41% to close the week at 1.085, driven by USD strength and dovish ECB press conference. ECB maintains the depo rate at 4.00% (C: 4.00%), with little new information in the statement. ECB President Lagarde does not offer explicit pushback against market pricing of rate cuts and instead stresses it is still “premature” to discuss cuts. ECB President Lagarde’s press conference was interpreted as dovish since she did not push back against pricing of cuts at the March and April meetings and highlighted, despite 1Q24 wage data still in focus, other data would be made available earlier. Probability of a ECB cut in Apr rose to 85%.
GBPUSD was unchanged at 1.2703 last week, driven by resilient UK macro data. Data wise, preliminary January S&P Global Composite PMI rose to 52.5 (C: 52.1; P: 52.1), accompanied by increase in both Services to 53.8 (C: 53.2; P: 53.4) and Manufacturing to 47.3 (C: 46.7; P: 46.2). GfK Consumer Confidence improved to -19 in January (C: -20; P: -22). Although confidence is still weak by historical standards, below the 10y average of -15, it is now at the highest level since January 2022. Trading range between 1.26 and 1.28.
USDJPY was relatively unchanged last week (+0.02% to 148.15). The BoJ maintained the status quo, with no change to forward guidance. In the economic outlook, it revised down its FY24 inflation outlook (CPI ex-fresh food), due to lower oil prices, and slightly revised up the FY25 inflation outlook to 1.8% (P: 1.7%), mainly due to base effects from the extension of government subsidies on energy prices. There were no changes to the underlying inflation outlook (CPI ex-fresh food and energy) throughout the forecast horizon. The bank also added the following sentence to its economic outlook report: “The likelihood of realizing this outlook has continued to gradually rise, although there remain high uncertainties over future developments.” The economic outlook report also suggested the bank has a more optimistic view for corporates’ price setting behavior as well as developments for wage negotiations. In summary, this points to the removal of NIRP in April/May. Data wise, Tokyo CPI (ex-fresh food) slows to 1.6% y/y in January (P: 2.1%). Immediate resistance at 149/150, while support level at 147.40/ 147.
Oil & Commodities
Crude Oil rose last week, with WTI (+6.27% to 78.01) and Brent (+6.35% to 83.55), bolstered by strong economic data from the United States (higher than expected 4Q GDP) and stimulus from China (RRR cut and stock rescue package) and a larger than expected drawdown in U.S. crude inventories. The EIA reported a drop of 9.23 million barrels in US crude stockpiles, led by a decline of 2.01 million barrels at the Cushing storage hub. Technically, WTI and Brent rose above their 200 days MA, while still not trading in overbought territory, indicates more upside from current level, and potential to test 80 (WTI) and 85 (Brent). Immediate support level on WTI at 77.60 (200 days MA) and on Brent at 81.67 (200 days MA).
Oil is rebounding this morning and is trading at its highest since early November last year (WTI around 78.50) after 3 US army soldiers were killed and more than 30 injured in a drone attack last night on a small US outpost near the Syrian/Jordan border.
Gold fell 0.54% to close the week at 2018.52, driven by USD strength and positive risk sentiment. Immediate support level at 2010/2000, while resistance level at 2025/2030.
Economic News This Week
-
Monday – NZ Trade Balance, SW Retail Sales, US Dallas Fed Mfg Act.
-
Tuesday – JP Jobless Rate, AU Retail Sales, UK Mortg. App., EU Cons/Econ/Indust/Svc Confid / GDP, US Cons. Confid./ JOLTS
-
Wednesday – JP Retail Sales/ Indust. Pdtn, AU CPI, CH PMI, UK House Px, US Mortg. App./ ADP/ MNI Chic. PMI/ FOMC Rate Decision, CA GDP
-
Thursday – JP/CH/SZ/NO/UK/EU/US Mfg PMI Jan Final, AU Building App., SW Riksbank Rate Decision, EU CPI/ Unemploy. Rate, UK BoE Rate Decision, US Initial Jobless Claims/ ISM Mfg/ ISM Prices Paid
-
Friday – NZ Building Permits, AU PPI, NO Unemploy. Rate, US Nfp/ Mich Sentiment/ Factory Orders/ Durable Goods Order
Sources – Various news outlets including Bloomberg, Reuters, Financial Times, FactSet, Associated Press
Disclaimer: The law allows us to give general advice or recommendations on the buying or selling of any investment product by various means (including the publication and dissemination to you, to other persons or to members of the public, of research papers and analytical reports). We do this strictly on the understanding that:
(i) All such advice or recommendations are for general information purposes only. Views and opinions contained herein are those of Bordier & Cie. Its contents may not be reproduced or redistributed. The user will be held fully liable for any unauthorised reproduction or circulation of any document herein, which may give rise to legal proceedings.
(ii) We have not taken into account your specific investment objectives, financial situation or particular needs when formulating such advice or recommendations; and
(iii) You would seek your own advice from a financial adviser regarding the specific suitability of such advice or recommendations, before you make a commitment to purchase or invest in any investment product. All information contained herein does not constitute any investment recommendation or legal or tax advice and is provided for information purposes only.
In line with the above, whenever we provide you with resources or materials or give you access to our resources or materials, then unless we say so explicitly, you must note that we are doing this for the sole purpose of enabling you to make your own investment decisions and for which you have the sole responsibility.
© 2020 Bordier Group and/or its affiliates.